
Hello All.
I have been looking for ways for quite sometime to understand my databases better. There are a lot of DMVs and even some DMFs that help us get some information from the SQL Server engine that can be very insightful. Many shops use monitoring tools and they are great because they watch things all the time. I used to rely solely on these tools to get me information about my SQL Server environment. That has shifted since I have been managing a SaaS platform built on top of SQL Server. With hundreds of TB of data and many databases being the same, it becomes pretty daunting to know which databases to care about and how much to care.
This article is about the start of things you can do to get ready for a better maintenance strategy or understanding how your indexes are used.
Let’s begin.
Problem
You have many tables in your databases and you want to know how they are used. There are DMVs for index usage stats which will tell you about like sys.dm_db_index_usage_stats and querying them is insightful, but how do the stats change over time? These stats are reset when the instance is restarted and it is good to know that you have 2000 seeks and 500 scans of the index, but when did they happen? Was it on a common day? Common hour?
Solution
First the elements of the solution should be defined:
- PowerShell at least 4.0 (preferable 5.1)
- SQL Server at least 2008 R2, but could be earlier but this is the earliest that I have run against
- A way to run a job/task
- dbatools.io Get the dbatools PowerShell Module
- Content listed below – and it will be on my Github Repository.
I say PowerShell because this is what I love to use for automation tasks. I will illustrate how to do this with SQL Server Agent, but it will still work with Task Scheduler. Let’s define the solution so that we can put the pieces together for use in your own environment. This will give you a good framework to gather any type of information, whether it be with TSQL, which this solution is using, or straight PowerShell and SMO or other items (like WMI).
First, we need to create a table to hold what I call Iterations to put lines in the sand and allow you to use timeframes in your statistics gathering. We will also need a SCHEMA called “stat” for holding the Index Usage data.
CREATE SCHEMA stat AUTHORIZATION dbo
Now the table…
/****** Object: Table [dbo].[Iterations] Script Date: 2/15/2020 3:40:49 PM ******/
SET ANSI_NULLS ON
GO
SET QUOTED_IDENTIFIER ON
GO
CREATE TABLE [dbo].[Iterations] (
    [IterationId] [int] IDENTITY(1,1) NOT NULL,
    [GatherDate] [datetime2](3) NOT NULL,
    CONSTRAINT [PK_Iterations_ID] PRIMARY KEY CLUSTERED (
        [IterationId] ASC
    )  WITH (PAD_INDEX = OFF, STATISTICS_NORECOMPUTE = OFF, IGNORE_DUP_KEY = OFF, ALLOW_ROW_LOCKS = ON, ALLOW_PAGE_LOCKS = ON, FILLFACTOR = 100) ON [PRIMARY])
ON [PRIMARY]
GO
ALTER TABLE [dbo].[Iterations] ADD DEFAULT (getdate()) FOR [GatherDate]
GO
Notice that we have an IDENTITY column which could easily be a SEQUENCE candidate from a DEFAULT on the IterationId column. Also notice that the only other column is the GatherDate as a datetime column. This allows us to put an INT (you could use a BIGINT) column for related tables instead of having dates to join on.
Next up is the table to hold the statistics.
CREATE SEQUENCE stat.IndexUsage_Seq as bigint
START WITH 1 INCREMENT BY 1
GO
/****** Object:  Table [stat].[IndexUsage]    Script Date: 4/20/2020 10:59:19 PM ******/
SET ANSI_NULLS ON
GO
SET QUOTED_IDENTIFIER ON
GO
CREATE TABLE [stat].[IndexUsage](
	[server_name] [nvarchar](128) NULL,
	[database_name] [nvarchar](128) NULL,
	[database_id] [smallint] NULL,
	[object_id] [int] NOT NULL,
	[schema_name] [sysname] NOT NULL,
	[table_name] [sysname] NOT NULL,
	[index_name] [sysname] NULL,
	[index_id] [int] NOT NULL,
	[user_seeks] [bigint] NULL,
	[user_scans] [bigint] NULL,
	[user_lookups] [bigint] NULL,
	[user_updates] [bigint] NULL,
	[last_user_seek] [datetime] NULL,
	[last_user_scan] [datetime] NULL,
	[iterationid] [int] NOT NULL,
	[IndexUsageId] [bigint] NOT NULL,
        CONSTRAINT [PK_stat_IndexUsage__IndexUsageId] PRIMARY KEY CLUSTERED
        (
	    [IndexUsageId] ASC
        ) WITH (PAD_INDEX = OFF, STATISTICS_NORECOMPUTE = OFF, IGNORE_DUP_KEY = OFF, ALLOW_ROW_LOCKS = ON, ALLOW_PAGE_LOCKS = ON, OPTIMIZE_FOR_SEQUENTIAL_KEY = OFF) ON [PRIMARY]
) ON [PRIMARY]
GO
ALTER TABLE [stat].[IndexUsage] ADD  CONSTRAINT [DF_IndexUsage_IndexUsageSeq]  DEFAULT (NEXT VALUE FOR [stat].[IndexUsage_Seq]) FOR [IndexUsageId]
GO
Next up is the query and to get the information, encapsulated in a PowerShell function called Get-BmaIndexUsage (Bma is to keep things separate from other functions, Bma is Ben Miller & Associates). There are parameters for the SQL instance and credential with the reporting instance and database to put the data in. This example will give you an idea of how easy it is to get the data and put it in the table.
Index Usage Stats
SELECT
    @@servername as [server_name],
    db_name() as [database_name],
    db_id() as [database_id],
    t.object_id,
    s.name as [schema_name],
    t.name as [table_name],
    ix.name as [index_name],
    ix.index_id,
    ius.user_seeks,
    ius.user_scans,
    ius.user_lookups,
    ius.user_updates,
    ius.last_user_seek,
    ius.last_user_scan,
    $IterationId AS [iterationid]
from sys.tables t
inner join sys.indexes ix on t.object_id = ix.object_id
inner join sys.schemas s on t.schema_id = s.schema_id
left join sys.dm_db_index_usage_stats ius on ius.object_id = ix.object_id and ius.index_id = ix.index_id
        and ius.database_id = DB_ID()
WHERE t.is_ms_shipped = 0;
Let’s tie this together before we get into why we would even do this activity.
- CREATE DATABASE DBA
- Inside DBA database
- CREATE SCHEMA stat AUTHORIZATION dbo
- CREATE SEQUENCE stat.IndexUsage_Seq
- CREATE TABLE dbo.Iterations
- CREATE TABLE stat.IndexUsage
- Command File with code to call PowerShell
- GetIndexUsage.cmd
- PowerShell file to run all the things to get the data with TSQL and put it in the table above
- GetIndexUsage.ps1
- Job in SQL Agent to get the stats and schedule for every hour
- When all of this is put into place, the next step is to understand how to use the information that has been gathered. With the IterationId in place, the data can be sliced by iteration, or more
REM This would go in the GetIndexUsage.cmd that would be called from the Agent Job in a CmdExec step.
@powershell c:\bin\GetIndexUsage.ps1
Import-Module dbatools
function Get-BmaIndexUsage
{
	param (
		[string]$ServerInstance,
		$SqlCredential,
		[int]$IterationId,
		[string]$ReportSqlInstance = "localhost",
		[string]$ReportSqlDb = "DBA"
	)

	# Scheduled Per Day
	# Run per Database

	$query = @"
select
	@@servername as [server_name],
	db_name() as [database_name],
	db_id() as [database_id],
	t.object_id,
 	s.name as [schema_name],
	t.name as [table_name],
	ix.name as [index_name],
	ix.index_id,
	ius.user_seeks,
	ius.user_scans,
	ius.user_lookups,
	ius.user_updates,
	ius.last_user_seek,
	ius.last_user_scan,
	$IterationId AS [iterationid]
--INTO stat.IndexUsage
from sys.tables t
inner join sys.indexes ix on t.object_id = ix.object_id
inner join sys.schemas s on t.schema_id = s.schema_id
left join sys.dm_db_index_usage_stats ius on ius.object_id = ix.object_id and ius.index_id = ix.index_id and ius.database_id = DB_ID()
WHERE t.is_ms_shipped = 0
ORDER BY [schema_name], [table_name], [index_id];
"@
	if($SqlCredential) {
		$s = Connect-DbaInstance -SqlInstance $ServerInstance -SqlCredential $SqlCredential
	}
	else {
		$s = Connect-DbaInstance -SqlInstance $ServerInstance
	}
	$dblist = $s.Databases.Name | Where { $_ -notin @("master","model","msdb","tempdb") }

	foreach ($db in $dblist)
	{
		try
		{
			if($SqlCredential) {
				$dt = Invoke-DbaQuery -SqlInstance $ServerInstance -Database $db -Query $query -As DataTable -SqlCredential $SqlCredential
			}
			else {
				$dt = Invoke-DbaQuery -SqlInstance $ServerInstance -Database $db -Query $query -As DataTable
			}
			$dt | Write-DbaDbTableData -SqlInstance $ReportSqlInstance -Database $ReportSqlDb -Schema stat -Table IndexUsage

		}
		catch
		{
			Write-Host "Error occurred in $($s.Name) - $($db) - IndexUsage"
		}

	}
}
Get-BmaIndexUsage -ServerInstance "localhost" -IterationId 1
The above PowerShell code would be run from the CMD file that runs and basically connects to the server specified in the bottom of the script, in this case “localhost” or change it to the real one. Then specifying the IterationId of 1 would get the data and put it in the table created with an IterationId of 1, and the next run would be 2 and so forth. If you execute the following TSQL you can get an IterationId from the dbo.Iterations table.
INSERT INTO dbo.Iterations (GatherDate) OUTPUT inserted.IterationId VALUES (GetDate())
A simple query to the sys.dm_db_index_usage DMV that will show what the statistics look like for the index. Key elements:
- DB_ID() in the where clause to look only in the database you are in. This DMV covers the entire instance so narrow it down with database_id = DB_ID()
- Object_id of the table, you can even use the OBJECT_ID(‘tablename’)
- Optionally you can narrow it down with the index_id as well
If I see that at 12:00 AM my indexes are being used 2 seeks and 1 scan and 4 updates. As shown in the graphic and then at 1:00 AM there are 10 seeks and 1 scan and 40 updates. At 2:00 AM there are 10 seeks and 1 scan and 100 updates and the following hour at 3:00 AM there are 20 seeks and 4 scans and 100 updates total. At 8:00 AM you get on the scene and find the final stats to be 100 seeks and 8 scans and 200 updates.
Let’s digest this, we did not watch every hour and when we did get a chance at 8:00 AM to look and see the final stats at 100 seeks, 8 scans and 200 updates. How do we know what happened? We have these statistics captured every hour by iterationId and datetime. I want to know how many seeks, scans and updates take place between 4:00 AM and 5:00 AM. Most monitoring software packages do not capture these stats at all, let alone capture it by hour to give you insights you need to understand how your index is being used and even potentially give you opportunity to understand when you may want to maintain the index.
Scenario
- Here is an example of a scenario that you can consider:
- I created 14 indexes on a table and I want to know a few things.
- 1. Are they being used at all?
- 2. Are they seeked or scanned?
- 3. How often are they being seeked or scanned?
SELECT
    I1.server_name,
    I1.database_name,
    I1.schema_name,
    I1.table_name,
    I1.index_name,
    I1.index_id,
    ISNULL(I1.user_seeks,0) as user_seeks_1,
    ISNULL(I2.user_seeks,0) as user_seeks_2,
    ISNULL(I2.user_seeks,0) – ISNULL(I1.user_seeks,0) as user_seeks_diff,
    ISNULL(I1.user_scans,0) as user_scans_1,
    ISNULL(I2.user_scans,0) as user_scans_2,
    ISNULL(I2.user_scans,0) – ISNULL(I1.user_scans,0) as user_scans_diff,
    ISNULL(I1.user_lookups,0) as user_lookups_1,
    ISNULL(I2.user_lookups,0) as user_lookups_2,
    ISNULL(I2.user_lookups,0) – ISNULL(I1.user_lookups,0) as user_lookups_diff,
    ISNULL(I1.user_updates,0) as user_updates_1,
    ISNULL(I2.user_updates,0) as user_updates_2,
    ISNULL(I2.user_updates,0) – ISNULL(I1.user_updates,0) as user_updates_diff
FROM stat.IndexUsage I1
INNER JOIN stat.IndexUsage I2 ON I1.server_name = I2.server_name
        and I1.database_name = I2.database_name
        and I1.object_id = I2.object_id
        and I1.index_id = I2.index_id
WHERE
    I1.IterationId = 4
    AND I2.IterationId = 5
    AND I1.table_name = 'MyTable'
    AND I2.table_name = 'MyTable'
The output from the query is below and this would give you insights into the indexes for a table and how they have behaved over the last hour since the iterations are sequential. If your interval is longer than 1 hour then it is 1 interval of time so you can see based on your interval how it behaved.
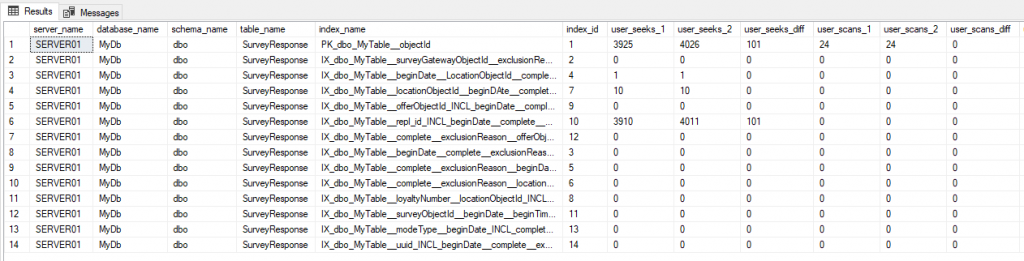
As you can see, the data is coming out with the 1 and the 2 and then a diff with the query. This gives you a view if it is 1 hour of data, then you know that the diff of Index 6 is 101 seeks in the last hour. Over time you can trend this data and see some correlations with some queries, or you see lots of 0’s like above, and that will help you know which indexes are used and maybe those are the ones that are needing maintenance more, if the updates are high.
Hopefully this was a good start to understanding how you can get some insights into your database with a little automation. Stay safe and Happy.
Pingback: Learning About Index Utilization with dbatools – Curated SQL
Thanks for the insights.
For SQL 2016 or higher, this would be a great place to use Temporal Tables and simply update the values. You could then use forensic-style queries to pull usage over several timeframes from the history table and calculate the delta values.
If 2017 or higher, you can also set the HISTORY_RETENTION to auto-clean your history tables and reduce further administrative work.
Good insight. I will see if it works for the data I gather.